A-LEVEL OCR ChEMISTRY NOTES
Chromatography and qualitative analysis
Chromatography
- Chromatography is a separation technique used for separating and identifying the species present in a mixture.
- The mobile phase is the substance in chromatography that carries the soluble components of the mixture
- The stationary phase is the substance in chromatography that holds back the components that are attracted to it.
- Each component in the mixture has a different level of solubility in the mobile phase and retention by the stationary phase, resulting in the separation of these components
Thin Layer Chromatography
Thin Layer Chromatography
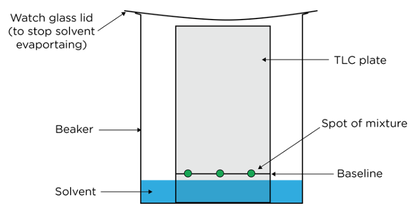
- In thin layer chromatography a plate is coated with a solid (stationary phase) and a solvent (mobile phase) moves up the plate
- An organic solvent is used as the mobile phase
- A sheet coated with a thin layer of silica gel or alumina acts as the stationary phase
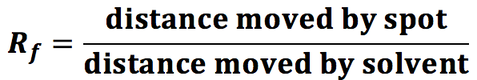
- Thin layer chromatography can be used to separate and identify components of a mixture by their Rf values.
- Different components have different attractions to the solvent and to the stationary phase. If a component is strongly attracted to the stationary phase it will not travel very far up the chromatogram
- TLC can be used to check the purity of a sample, or to determine the extent of a chemical reaction
- The Rf values can be compared to database values in order to identify components
Gas Chromatography
- In gas chromatography (GC) a column is packed with a solid or with a solid coated by a liquid, and a gas is passed through the column under pressure at high temperature.
- Stationary phase is a solid or liquid coating inside a long-coiled tube
- An inert gas such as N2 acts as the mobile phase
- Stationary phase is a solid or liquid coating inside a long-coiled tube

- The time taken for a component to leave the coil is called the retention time. This can be compared with standards to identify different substances.
- A chromatograph shows these retention times as a series of peaks with the area under each peak being proportional to the amount of that component present
- Mass spectrometry can be used to analyse the components separated by GC
- The mass spectrum of each component can be compared to spectra in a database, allowing the components to be identified with greater certainty.
Tests for Ions
- Qualitative tests give information on the identity of ions present in a sample
- To test for the presence of carbonate ions in a sample:
- Add a dilute strong acid to the sample. If carbonate ions are present CO2 (g) will evolve
- Test the gas evolved by bubbling it through limewater, if it is CO2 the limewater turns cloudy due to the formation of CaCO3
- To test for the presence of halide ions in solution, add dilute nitric acid and an aqueous solution of AgNO3
Silver Halide |
Colour of Precipitate |
Addition of Dilute Ammonia |
Addition of Concentrated Ammonia |
AgCl |
White |
Dissolves to give a colourless solution |
Dissolves to give a colourless solution |
AgBr |
Cream |
Remains |
Dissolves to give a colourless solution |
AgI |
Yellow |
Remains |
Remains |
- To test for the presence of sulfate ions in a sample, add barium ions. Ba2+ (aq) + SO42- (aq) → BaSO4 (s). BaSO4 is a white precipitate
- To test for ammonium ions add sodium hydroxide solution and warm gently
- NH4+ (aq) + OH- (aq)→NH3 (g) + H2O (l)
- Test the gas evolved with damp red litmus paper. If the sample contains ammonium ions, the red litmus paper will turn blue
- Test the gas evolved with damp red litmus paper. If the sample contains ammonium ions, the red litmus paper will turn blue
- NH4+ (aq) + OH- (aq)→NH3 (g) + H2O (l)
- To test for transition metal ions, add aqueous ammonia or sodium hydroxide dropwise
- Cu(II) → Blue precipitate
- Fe(II) or Cr (III) → Green precipitate
- Mn(II) → Brown precipitate
- To distinguish Fe(II) or Cr(III) add excess ammonia
- Cr(III) → Purple solution
- Fe(II) → No change
Tests for Functional Group
Functional Group |
Test |
Result |
Alkene |
Br2 (aq) |
Decolourises |
Haloalkane |
AgNO3 (aq) and ethanol |
White ppt – Cl- Cream ppt – Br- Yellow ppt – I- |
Carbonyl |
Brady’s reagent |
Yellow/orange ppt |
Aldehyde |
Tollen’s reagent |
Silver mirror |
Carboxylic acid |
Universal indicator or metal carbonate |
pH of a weak acid. Effervescence with a carbonyl |
Phenol |
Universal indicator, no reaction with carbonates |
pH of a weak acid. No effervescence with a carbonyl |
Alcohol |
H+ / Cr2O72- |
Colour change from orange to green if it is a 1o or 2o alcohol |